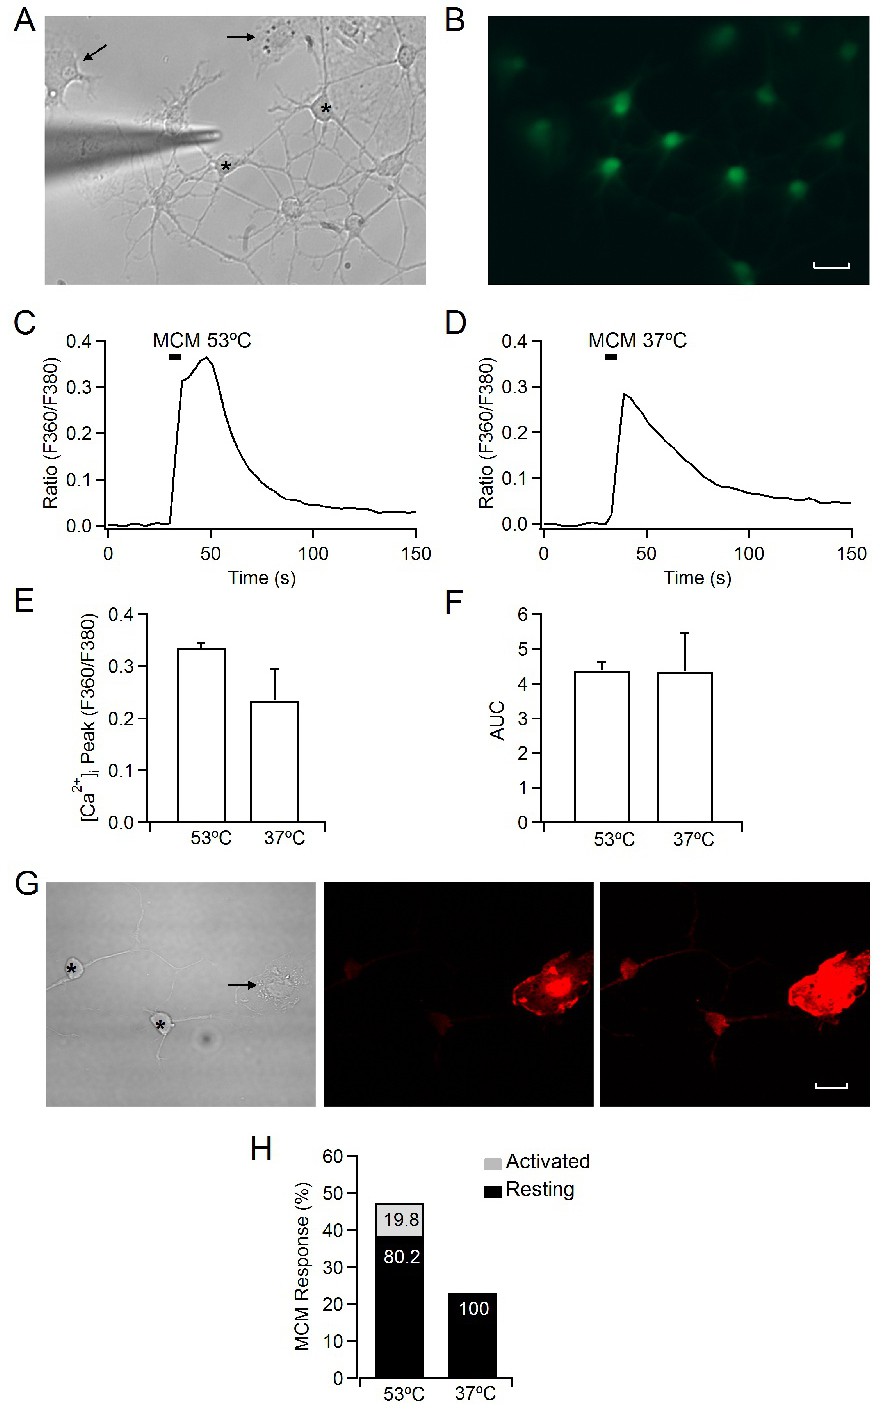
Fig. 1. Calcium imaging of microglial cells. A) Phase-contrast image of rat cultured microglia and a glass micropipette of 1mm f connected to a picospritzer which applies 5 s pressure ejection (2.5 psi) pulses. B) Fluorescence image showing the same cells loaded with the Ca2+ sensitive dye Fura 2-AM. C) Representative trace of [Ca2+]i transient in a cell evoked by the application of MCM obtained after MCs degranulation at 53°C. D) Representative trace of [Ca2+]i transient in a cell evoked by application of MCM obtained after MCs incubation at 37°C. E) Mean [Ca2+]i peak and F) Area under curve (AUC) obtained in microglia-evoked responses by stimulation with MCM at 53°C and 37°C. G) Anti-Iba1 immunostaining of microglial cells with different morphological phenotype (2 resting cells with ramified long processes and rounded cell bodies (*) and 1 activated cell with an amoeboid appearance (arrow)). Left panel shows cells in bright-field, middle and right panels show fluorescence images taken at 60X and a 366 hV and 536 hV of gain, respectively. H) Percentage of microglia activated by MCM at 53°C and 37°C. Numbers inside the bars indicate the proportion of activated or resting cells that showed a [Ca2+]i transient after MCM application. Scale bar: 10 mm.